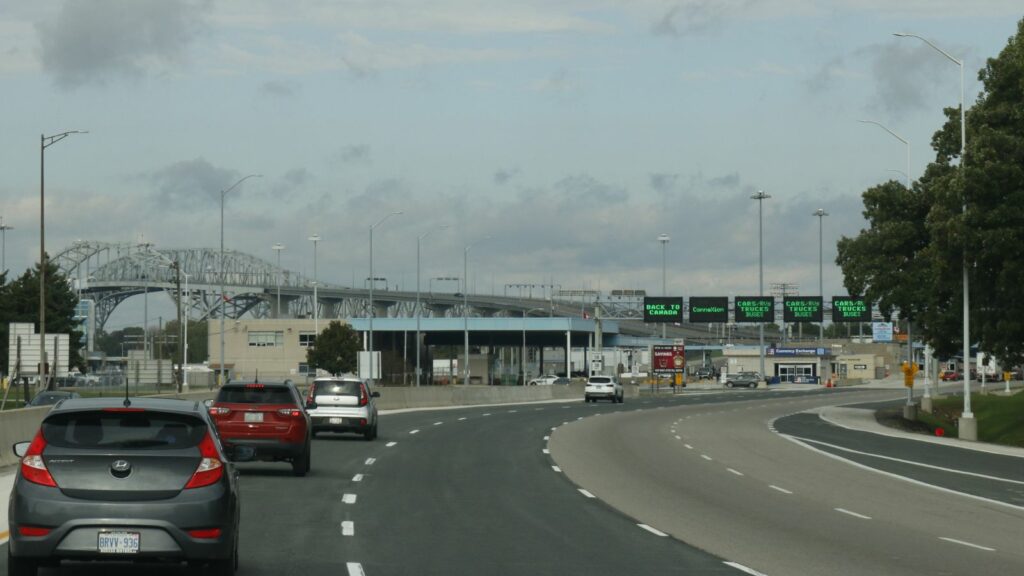
For years, crossing the Canada–U.S. border was an ordinary part of life for millions of travellers, whether for a weekend getaway, a family visit or a shopping trip. New figures suggest that relationship is changing in ways that do not look the same on both sides.
Statistics Canada reported on October 13 that Canadians returning by car from the United States in September 2026 made 31.1% fewer trips than in September 2024, even though crossings had recovered somewhat from last year. Meanwhile, trips to Canada by U.S. residents increased 17.2% compared with September 2025. A shifting holiday calendar helped amplify the American increase, and the figures remain preliminary. Beyond the percentages lies a broader story about changing travel habits, tourism spending and communities tied to the border.
The Two Headline Percentages Tell Different Stories
The striking contrast in Statistics Canada’s September report is real, but the percentages answer different questions. The 31.1% decline compares Canadian-resident returns by automobile from the United States in September 2026 with the same month in 2024. The 17.2% increase compares visits to Canada by U.S. residents, travelling by automobile or air, with September 2025. Treating those numbers as equivalent year-over-year measures would give a misleading picture of cross-border travel.
Overall, the agency’s early indicator counted roughly 5.3 million international arrivals to Canada in September, including returning Canadians and arriving American and overseas residents. That represented a 9.5% increase from September 2025. The apparently conflicting trends can therefore coexist: some traffic has recovered from a particularly weak year, even as Canadian driving remains far below its earlier level. The figures describe recorded border movements, not the number of distinct people taking trips or their reasons for travelling in either direction.
Canadian Driving Trips Have Rebounded, but Not Fully Recovered
Canadians returning by automobile from the United States made 5.6% more trips in September 2026 than in September 2025. Yet that improvement did not come close to erasing the 31.1% decline from September 2024. Statistics Canada’s August update showed a similar split: automobile returns rose 9.9% over August 2025 but remained 27.4% below August 2024. Taken together, the two months suggest a modest rebound from depressed levels rather than a return to familiar border traffic.
Flying tells a related story. Canadian-resident returns from the United States by air climbed 11.6% compared with September 2025, but remained 18.7% below September 2024. Combining air and automobile, the September 2026 count reached 1,889,652 return trips, a 6.8% annual increase and the sixth consecutive month of year-over-year growth. A family resuming an occasional U.S. visit and another choosing not to cross can both contribute to that uneven recovery. The statistics cannot identify individual choices.
Americans Are Making More Trips North by Road and Air
U.S. residents took 1,806,757 trips into Canada by automobile and air in September 2026, up 17.2% from a year earlier. Automobile arrivals accounted for 1.3 million, a 19.5% increase, while air arrivals reached about 537,400, up 12.2%. The month marked the eighth consecutive year-over-year increase in U.S.-resident arrivals. For Canadian restaurants and attractions serving visitors, the direction of travel is potentially welcome news.
That does not mean American tourism has reached an all-time high. Statistics Canada’s separate visitor survey showed U.S. residents took 22.8 million trips to Canada throughout 2025, down 3.0% from 2024 and 8.8% below the 2019 level. September’s sharp improvement therefore sits within a longer period of fluctuation. Nor can the latest border tally establish that visitors stayed longer or spent more per trip. A car crossing for lunch and a flight arriving for a week both count as arrivals, despite very different implications for local businesses.
The Labour Day Calendar Helped Lift September’s Numbers
Timing shaped the new figures. Statistics Canada attributed much of the September increase in visits by U.S. residents to a calendar effect: Labour Day occurred on September 7 in 2026, one week later than in 2025. Shifting long weekends can change which days travellers cross, when they return and how closely one month’s total resembles the same month a year earlier. A single headline percentage cannot separate holiday scheduling from lasting shifts in demand.
Daily data show how concentrated border movements become. On Friday, September 4, ahead of the long weekend, U.S.-resident arrivals peaked at 124,200. The low was 37,800 on Tuesday, September 29. For returning Canadians from all foreign destinations, Labour Day itself brought 195,100 arrivals, compared with 69,200 on September 23. Those peaks demonstrate how holidays shape reported travel. They also caution against reading September’s 17.2% U.S. increase as a precise measure of changing American enthusiasm for Canada.
The Bigger Canadian Pullback Began in 2025
September’s numbers make more sense against the dramatic reversal that began last year. A July 2026 Statistics Canada study found 39 million Canadian-resident return border crossings from the United States in 2024, representing three-quarters of all return crossings from abroad. In 2025, that U.S. total fell 25.4%, while its share of foreign return crossings declined to roughly two-thirds. Researchers noted a shift in travel sentiment following changes in U.S. leadership and America First policies.
The study identified eleven months of year-over-year declines, the longest and deepest such streak outside the pandemic since digital recordkeeping began in 1972. Automobile travel fell particularly quickly, while prebooked flights were generally harder to change. This context explains why a small gain against 2025 can coexist with a large shortfall against 2024. It does not establish that politics caused every cancelled trip: budgets, exchange rates, family commitments and alternative destinations can all influence travel decisions.
Fewer Canadian Trips Mean Less Spending in the United States
The change is more than a count of cars. Statistics Canada found spending by Canadian travellers on visits to the United States dropped by C$3.3 billion in 2025, to C$18.8 billion. Spending on leisure-related visits accounted for C$2.2 billion of that decline and totalled C$12.1 billion. Fewer trips can affect destinations that depend on Canadian visitors, from short-stay restaurants near border crossings to vacation businesses farther south.
The financial pattern continued into early 2026. In the first quarter, Canadian residents made 5.5 million visits to the United States, down 10.6% from the same quarter a year earlier, and spent C$5.0 billion, down 13.6%. Average spending was C$206 per same-day visit and C$1,344 per overnight visit. These figures explain why fewer travellers can have very different financial consequences depending on trip length. They are survey estimates for earlier periods, however, not evidence of how much Canadians spent during September 2026 specifically.
Border Communities Could Feel the Loss of Same-Day Trips
Changes in travel habits can be visible near the border. Statistics Canada’s complete September 2024 figures showed that 63.5% of Canadian automobile trips returning from the United States were same-day trips. Crossings near Vancouver, Southwestern Ontario and Niagara together handled 59.4% of those returns. That concentration matters to cafes, shops and service businesses that rely on regular cross-border customers throughout the year. Cross-border tourism often involves ordinary errands, not extended vacations.
A day trip might mean a family meal or purchases before crossing home. Repeated visits can matter to businesses serving regular border traffic. The September 2026 leading indicator does not provide a comparable breakdown of spending in those communities, so it cannot establish how much revenue individual stores have lost. Nor should 2024’s same-day share be assumed unchanged today. What the figures do establish is that Canadian driving remains substantially below the previous benchmark, making local exposure worth watching.
Canadians Are Also Spending More Time Travelling Elsewhere
Avoiding the United States has not necessarily meant abandoning travel. Statistics Canada’s 2025 analysis found Canadian residents made 5.0 million more domestic visits and 1.3 million more overseas visits than in 2024. Visits to Europe increased 13.6%, while visits to Asia rose 16.7%. The combined growth in domestic and overseas travel almost entirely offset the decline in visits to the United States, suggesting that many Canadians redirected their plans rather than simply staying home.
That diversification remained visible in later figures. In the first quarter of 2026, Canadians made 4.6 million trips involving overseas visits, up 6.2% from a year earlier, while overseas spending climbed 16.7% to C$10.1 billion. For September, the latest border indicator recorded 1,000,772 Canadian-resident returns from overseas by air, an annual increase of 3.2%. These measures come from different statistical programs and periods, but all point to an international travel market extending beyond Canada’s southern neighbour.
Canada’s Tourism Businesses Have Reasons to Welcome U.S. Visitors
Tourism dollars flow both ways across the border, even when traveller counts diverge. Statistics Canada’s first-quarter 2026 visitor survey estimated that U.S. residents made 3.6 million trips to Canada, up 3.4% from a year earlier, and spent C$3.0 billion, a 16.5% increase. Of those trips, 42.8% were same-day visits. A traveller stopping for a few hours contributes differently from someone booking several nights in a hotel.
The survey estimated average spending of C$170 on a same-day U.S.-resident trip and C$1,323 on an overnight trip, with overnight travellers staying an average of 5.4 nights. Those numbers illustrate why tourism operators examine both visitor volume and visitor spending. September’s 17.2% arrival jump may create opportunities for Canadian businesses, but it does not yet show what Americans spent that month. Better traffic is encouraging; lasting gains in tourism income require visitors to stay, eat, shop and use local services, especially in tourism-dependent communities.
The Preliminary Count Comes With an Important Warning
The September release is preliminary, not the complete count. Air arrivals come from border inspection kiosks, which captured 86.2% of commercial air entries in 2025. Automobile counts combine automated inspections and NEXUS records; inspection-line systems covered 87.9% of automobile entries that year. Changing coverage affects historical comparisons. Its timeliness is valuable, but its coverage remains incomplete by design.
Indeed, Statistics Canada warns that expanded integration of NEXUS Highway information in 2026 means comparisons for September 2026 and later months with previous years require caution. The report also excludes certain travel modes and does not measure the motivations behind individual trips. More complete September figures are scheduled for November 23, while the next preliminary release, covering October, is due November 12. Until then, the clearest conclusion is a qualified one: Canadian driving is recovering against 2025 but remains depressed against 2024, while American arrivals have grown sharply in a holiday-affected month.
