
A town can still look unmistakably local while its economic orbit quietly shifts toward a much larger city. The first clues often appear on weekday mornings: fuller highways, crowded station lots, new subdivisions and residents whose jobs are somewhere else. Over time, housing demand, transportation planning and even local incomes can become increasingly tied to employment opportunities beyond municipal boundaries.
Canada’s geography makes these connections measurable. Statistics Canada tracks where residents live, where they work, how they travel and how strongly smaller municipalities are influenced by nearby metropolitan areas. No single change proves that a community has become a commuter market, but several appearing together can tell a compelling story. These 17 signs help show when a Canadian town is evolving from a largely self-contained community into a place increasingly shaped by workers travelling to a larger employment centre.
More Residents Work Outside the Municipality

The clearest signal is also the most measurable: an increasing portion of employed residents travels beyond the town’s municipal boundary for work. Statistics Canada specifically tracks commuting destinations at the census-subdivision level, allowing communities to see how many workers remain within their municipality and how many travel elsewhere. When the outbound share rises over several census periods, the local housing market may increasingly be serving a regional rather than purely local labour force.
That distinction matters because commuter towns do not necessarily lack jobs. A town may have shops, schools, construction companies, health services and industrial employers while still sending a large share of its professional workforce elsewhere each morning. The critical question is whether the town where people sleep is becoming less closely connected to the town where they earn their income. Statistics Canada even uses commuting flows when defining the relationship between municipalities and larger metropolitan areas, making outbound commuting one of the strongest indicators available.
Morning Traffic Starts Moving in One Obvious Direction

Traffic can reveal a commuter market long before a town centre looks dramatically different. A typical pattern develops when vehicles pour toward the same highway interchange or neighbouring metropolitan area in the morning, then return in the opposite direction late in the afternoon. Instead of traffic being distributed among local destinations throughout the day, weekday movement starts resembling a regional tide.
Southern Ontario offers particularly clear examples. Statistics Canada found that more than 90% of workers travelling from several surrounding urban centres into Toronto used automobiles. Among Toronto-bound commuters from the Barrie and Guelph census metropolitan areas, automobile shares were approximately 97% and 96%, respectively. Similar patterns existed from Oshawa and Hamilton. Those figures should not be automatically applied to every Canadian community, but they demonstrate what a mature commuter corridor can look like. When an otherwise modest town develops increasingly intense, directional rush-hour traffic, regional employment is probably becoming more important to its residents.
Longer Commutes Stop Looking Exceptional

A town’s effective distance from a major city is not simply the number of kilometres on a road sign. It is also the amount of travel time residents are willing to accept. As a commuter market strengthens, journeys that once seemed unusually long can become routine among working households, especially when local housing offers enough space or savings to compensate for additional driving.
Statistics Canada defines a long commute as one lasting 60 minutes or more. In 2016, roughly 1.5 million Canadians experienced commutes of at least an hour across transportation modes. Among car commuters whose trip lasted 60 minutes or longer, the median one-way distance to a fixed workplace was approximately 40 kilometres, compared with roughly 8 kilometres for other car commuters. Long commuting also rebounded after the early pandemic period: Statistics Canada reported a 51.7% increase in the number of workers with hour-long car commutes between May 2021 and May 2023. A growing local population willing to make such trips is a meaningful commuter-market signal.
Park-and-Ride Lots Become Important Pieces of Infrastructure

A large parking lot beside a train station or express-bus terminal may not look transformative, but it reveals an important relationship between housing and employment. Park-and-ride facilities allow people to live beyond easy walking distance of regional transit while still using that network for the longest part of the journey. Growing demand for these spaces can therefore indicate that a town’s residential catchment is feeding a metropolitan transportation system.
The scale can be substantial. Metrolinx reported nearly 73,000 parking spaces across its GO rail station network in its station-access work, while an earlier planning exercise found many GO parking facilities at or near capacity. In Metro Vancouver, TransLink currently identifies 20 park-and-ride locations connected to SkyTrain, major bus exchanges and other services. These facilities are not proof that every surrounding neighbourhood is a commuter community, but persistent parking pressure, expansion proposals or new feeder connections show that residents increasingly need transportation designed around jobs located beyond their immediate neighbourhoods.
Transit Schedules Begin Revolving Around the Workday
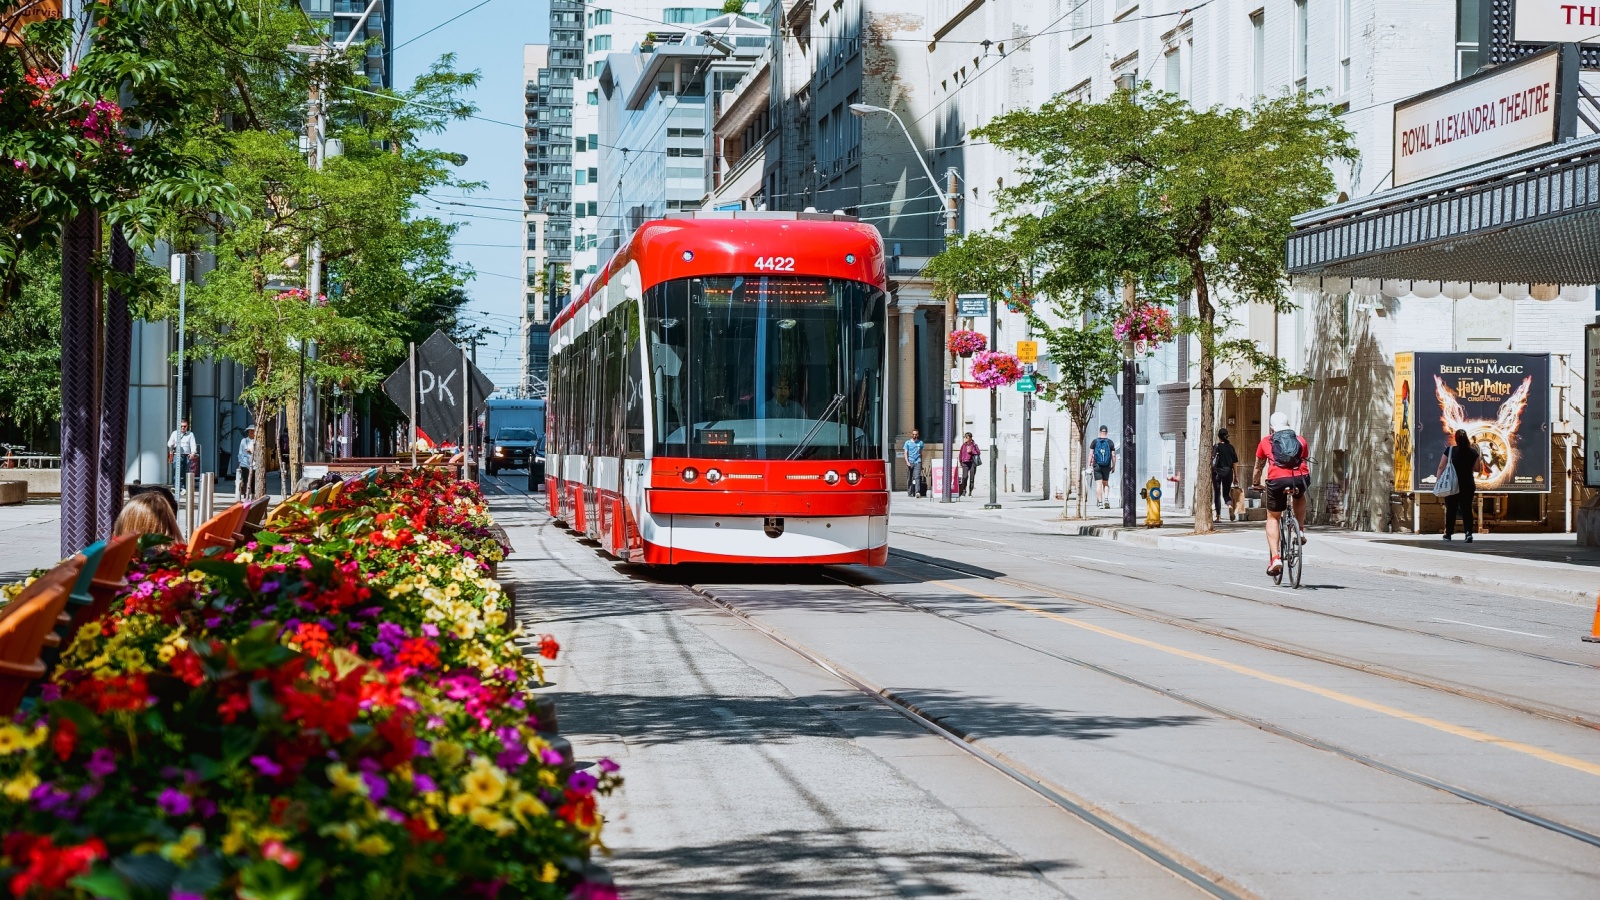
A local transit system designed mostly for shopping, medical appointments and general mobility tends to operate differently from a service built around commuters. One revealing change occurs when the strongest frequencies, direct routes or specialized services concentrate heavily around weekday morning and afternoon peaks. Transportation is effectively being organized around getting residents to another employment centre and bringing them back again.
British Columbia’s West Coast Express provides a striking Canadian example. The commuter rail service operates between Mission and Downtown Vancouver on weekdays during the morning and evening rush periods. Trains travel toward downtown Vancouver in the morning and toward Mission in the afternoon and evening, an unmistakably directional commuter pattern. Larger transit networks also increase frequency during peak periods because demand is strongest then. When a smaller town begins receiving express buses, additional peak trains or timed feeder services aimed primarily at metropolitan workers, transportation planning is acknowledging that the community functions as part of a much larger labour market.
Cars Remain Dominant Even as the Town Grows

Growth does not automatically make a community less car-dependent. In fact, a town expanding outward while becoming more closely linked to a distant employment centre may experience the opposite. Detached housing, highway-oriented subdivisions and workplaces several municipalities away can make the automobile difficult to replace, even when the community itself remains relatively compact by big-city standards.
Canada remains highly car-oriented for commuting. Statistics Canada reported that 80.9% of commuters mainly used a car, truck or van in May 2025. Earlier pandemic-era data also showed that the decline in car commuting was smaller in rural and small-town Canada than in census metropolitan areas. The figures differ considerably from one municipality to another, so the national percentage is not a benchmark every town should resemble. More revealing is the local direction of change. If population and housing are rising while the share of residents driving to work stays extremely high—or increases—new growth may be tied more strongly to regional commuting than to local job creation.
Most Commuter Vehicles Carry Only One Worker

Heavy traffic alone can have many causes. A stronger commuter-market clue appears when that traffic consists overwhelmingly of individual workers making separate trips toward the same employment centre. Statistics Canada’s census measures vehicle occupancy specifically by the number of workers travelling in a car, truck or van, making it possible to distinguish solo work trips from genuine worker carpools.
The Toronto region illustrates how pronounced the pattern can become. Among Oshawa residents commuting into Toronto in the 2021 Census data highlighted by Statistics Canada, about 90% travelled by automobile and roughly the same proportion were drivers who were the only worker in the vehicle. More than nine in ten Hamilton-to-Toronto automobile commuters were also driving alone as workers, and comparable patterns appeared among commuters from Barrie and Guelph. A town where the morning highway increasingly fills with single-worker vehicles is not simply experiencing population growth. It may be developing a workforce whose employment geography depends heavily on another city.
Hybrid Work Makes Greater Distances Practical

Remote work was once expected to eliminate many long commutes. Instead, hybrid arrangements have sometimes changed the calculation. A worker travelling to an office two or three days per week may tolerate a distance that would have been exhausting five days per week. That can enlarge the geographic area from which employers attract workers—and the area in which metropolitan employees consider buying homes.
Statistics Canada found that hybrid workers who commuted had an average commuting time of 40.8 minutes in May 2024. That was 14.4 minutes longer than the average among workers who usually travelled to their workplace every day. The difference does not prove that hybrid work caused every household to move farther from an office, but it shows that hybrid commuters are already travelling considerably longer on the days they go in. For towns within occasional commuting range of Toronto, Vancouver, Montréal, Ottawa, Calgary or other employment hubs, hybrid arrangements can therefore expand the practical commuter belt without requiring residents to make the journey daily.
Home Prices Start Responding to Big-City Demand

One of the most consequential signs arrives when local housing stops being priced only around local economic conditions. Buyers earning metropolitan salaries can compete for homes in communities where the local wage structure is lower, particularly when the town provides larger properties or comparatively affordable ownership. The result can be rapid housing-market integration even while municipal boundaries remain unchanged.
The Bank of Canada documented a notable version of this phenomenon during the pandemic. Its research found that homebuyers increasingly favoured suburban and rural areas, partly because of remote work and demand for additional space, and that house prices consequently rose faster farther from city centres. The Bank has also examined the broader suburban house-price boom and the traditional trade-off between housing cost and distance from employment centres. These pandemic conditions were unusual and should not be treated as permanent. Still, when a town’s housing prices increasingly respond to demand originating in a nearby metropolis, rather than primarily to local employment and incomes, commuter-market pressure is likely strengthening.
New Residents Increasingly Arrive From Larger Urban Areas

A commuter town usually needs more than existing residents deciding to drive farther. Its transformation often accelerates when households relocate from larger urban centres while keeping professional, family or economic ties to those places. Intraprovincial migration can therefore provide an important clue about why a smaller community is suddenly growing faster than its historical norm.
Statistics Canada recorded substantial population growth in numerous smaller centres during and after the pandemic-era movement of households. In 2021/2022, more than 92% of census agglomerations experienced positive demographic growth. Lachute, Quebec, near Montréal, grew 4.2%, while Wasaga Beach, Ontario, grew 3.9%; migration from elsewhere within their respective provinces was the main source of growth in both places. Smaller-centre growth has many causes, including retirement, immigration and local employment, so migration alone does not establish commuter status. The stronger signal appears when newcomers arrive from a nearby metropolis and continue to depend on its workplaces, transportation links or salary levels.
Housing Development Pushes Farther Onto the Fringe

Commuter-market growth often becomes physically visible at the edge of town. Agricultural or undeveloped land begins turning into subdivisions, townhouse projects and new neighbourhoods connected to major roads. The historic centre may change slowly while the municipality’s outer boundary absorbs most of the population increase.
Statistics Canada has documented both suburban growth and the continuing role of urban sprawl in Canadian housing construction. Its analysis of new housing supply distinguishes between development created through densification and development that expands the physical footprint of urban areas. Meanwhile, the 2021 Census showed strong growth in numerous communities connected economically to larger urban regions. Fringe construction is not inherently commuter development; fast-growing local industries can produce the same landscape. The distinction becomes clearer when new neighbourhoods are positioned for fast highway or regional-transit access and when residents disproportionately work elsewhere. In that combination, housing is effectively being added to a metropolitan labour market even though the homes sit beyond the metropolitan core.
Buyers Place a Premium on More Living Space

The commuter bargain often revolves around space. A household accepts additional distance from a major employment centre in exchange for a detached home, an extra bedroom, a yard or a lower price per unit of space. When this preference becomes a major source of local demand, builders and sellers may increasingly target buyers whose jobs and purchasing power originate elsewhere.
Bank of Canada research documented this shift particularly clearly during the pandemic. Demand moved away from some condominium markets and toward larger single-family homes, while buyers increasingly looked to suburban and rural locations. The Bank noted that larger lots and houses were typically easier to obtain away from central locations and that the desire for more space contributed to the suburban housing boom. The intensity of that pandemic-era change has since moderated, and current housing conditions differ from those of 2020 and 2021. Even so, the underlying trade-off remains important: a town offering substantially more housing space within tolerable commuting distance can become attractive to metropolitan workers surprisingly quickly.
Local Incomes Begin Reflecting Metropolitan Connections

A commuter market can change household economics even when it does not bring the same number of jobs into town. Residents who earn salaries in a larger city bring those incomes home, where they influence housing demand, renovation spending, retail activity and the ability to bid for limited local property. Over time, earnings can look unusually strong compared with communities of similar size that lack major employment centres nearby.
Statistics Canada has found a measurable relationship between commuting connections and earnings in rural areas. Research published in 2025 reported that average earnings in rural areas were highest in places with strong commuting ties to large metropolitan areas with populations above 500,000. Earlier Statistics Canada research reached a similar conclusion, finding that rural areas with strong metropolitan relationships tended to be less economically disadvantaged than more weakly connected rural regions. Those findings do not mean metropolitan commuting automatically makes a town prosperous. They do show why rising household incomes, without a similarly dramatic expansion of local high-paying industries, can be an important sign of regional labour-market integration.
The Town Exports More Workers Than Its Local Economy Absorbs

Another useful indicator emerges when residential growth and workplace growth move in different directions. A town may add thousands of working-age residents while local employment expands much more slowly. The result is a growing daily outflow: the municipality is increasingly successful as a place to live without becoming equally important as a place to work.
Canada’s census data are designed to reveal this distinction. Statistics Canada publishes commuting flows between census subdivisions and separately measures whether employed residents work inside their municipality, elsewhere in their census division or farther away. That makes it possible for planners to compare the resident workforce with local commuting destinations rather than assuming population growth equals employment growth. The interpretation requires care because some people work from home, have no fixed workplace or hold jobs that are difficult to geographically assign. Still, when census results repeatedly show expanding outbound commuting alongside strong residential construction, the town is behaving increasingly like a labour exporter within a regional economy.
Development Starts Clustering Around Transportation Corridors

The location of new construction can say almost as much as the amount being built. In a commuter market, access to the regional transportation network becomes valuable enough to influence where developers want to build. Land near train stations, express-bus terminals, highway interchanges and major arterial roads can attract housing precisely because it reduces the practical cost of living farther from employment.
Canadian housing and infrastructure policy increasingly recognizes the connection between transportation and development. CMHC defines transit-oriented development as concentrating land uses around transit stations or corridors, typically with greater density and transportation choice. The federal Canada Public Transit Fund similarly emphasizes transit-oriented communities and housing supply. The resulting development does not always create traditional bedroom communities; good transit can support substantial local employment as well. But in a smaller town, repeated projects marketed or planned around rapid access to a distant metropolitan centre are a strong clue that regional commuting has become part of the land-value equation.
Housing Affordability Becomes a Commute Calculation

At a certain point, prospective households stop comparing homes only within the town. They compare the combined cost of housing and transportation across an entire region. A less expensive home 40 or 60 kilometres from work can appear financially attractive even after fuel, vehicle depreciation, transit fares and additional travel time are considered. That calculation is at the heart of many commuter markets.
The Bank of Canada’s housing research describes the long-established relationship between distance and property values: housing has traditionally become cheaper as distance from a major city centre increases. During the pandemic, that gradient changed as demand strengthened farther from downtown areas, but the basic trade-off between location and housing cost remained important. Canadian research using Southern Ontario commuting patterns has likewise examined how shelter costs can push feasible housing locations outward. For a town, the clearest sign is behavioural: buyers increasingly describe its value not in isolation, but relative to what the same household could afford closer to the metropolitan workplace.
Statistics Canada Starts Showing Strong Metropolitan Influence

The final sign is less visible than subdivisions or highway traffic, but it is one of the most authoritative. Statistics Canada formally classifies municipalities outside census metropolitan areas and census agglomerations according to how strongly their employed residents commute into larger urban centres. In other words, the federal statistical system has an explicit way of measuring the metropolitan pull that defines commuter markets.
Under the metropolitan influenced zone framework, a municipality outside a CMA or CA is considered strongly influenced when at least 30% of its resident employed labour force commutes to work in one or more CMAs or CAs. Moderate influence begins at 5% and extends to below 30%, while weaker categories capture smaller commuting shares. Separate commuting-flow rules are also used when determining which municipalities belong inside CMAs and CAs themselves. A town does not need an official label to feel like a commuter community, but when its statistical classification starts reflecting stronger metropolitan integration, the change is no longer merely anecdotal. It is visible in the movement of its workforce.
16 Costco Canada Habits That Could Be Costing Shoppers More Than They Save

The Executive Membership can feel like an obvious upgrade because the 2% annual reward sounds straightforward. For households that spend heavily at Costco Canada, the extra fee may be easy to justify. But the habit becomes costly when shoppers upgrade first and calculate later. A Gold Star Membership costs less, while Executive costs more and only pays off if eligible annual spending is high enough to offset the difference.
16 Costco Canada Habits That Could Be Costing Shoppers More Than They Save
