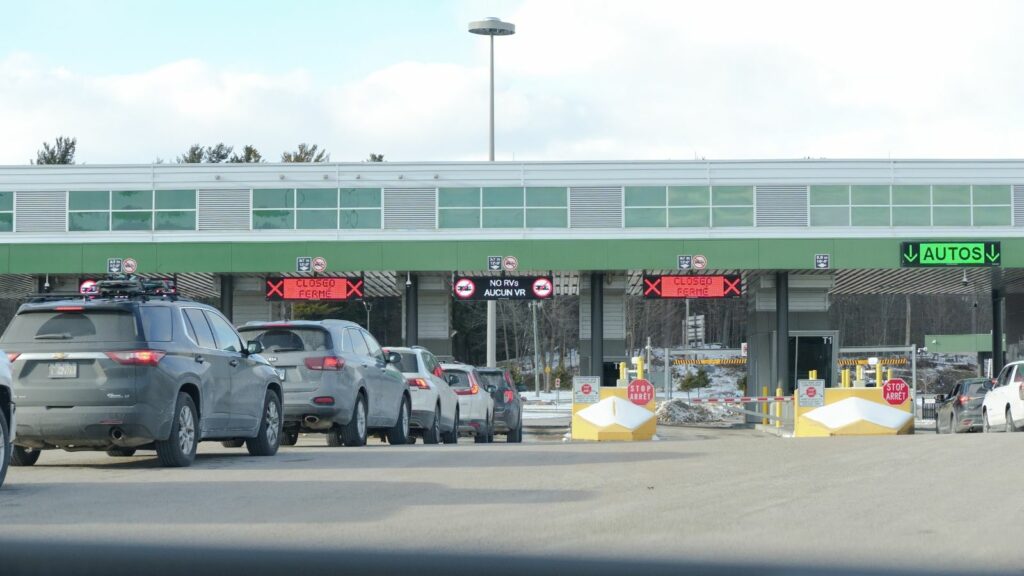
Traffic across two important Michigan-Ontario border crossings is sending a complicated signal about the state of Canada-U.S. travel and trade. Commercial truck crossings at the Blue Water Bridge fell about 14% through the first eight months of 2026 compared with the same period in 2025, while passenger traffic at the Sault Ste. Marie International Bridge remained about 23% below comparable 2024 levels.
The declines matter because the bridges serve very different roles. Blue Water is a major freight route linking Ontario with the U.S. Midwest, while the Sault crossing is deeply woven into the daily commercial and social life of two neighbouring communities. Yet newer data also suggest the story is no longer simply one of uninterrupted decline.
The Headline Numbers Need Two Different Baselines
The two percentages tell related stories, but they should not be treated as identical measurements. At the Blue Water Bridge between Port Huron, Michigan, and Point Edward, Ontario, commercial truck traffic fell from more than 1.4 million crossings during January through August 2025 to roughly 1.2 million during the same eight months of 2026. That works out to a decline of approximately 14%.
The Sault Ste. Marie passenger figure uses an earlier benchmark. Passenger-vehicle crossings during the first eight months of 2026 were about 23% below the corresponding period in 2024. That distinction matters because 2025 was itself an unusually weak year at the Sault crossing. Total annual traffic there fell from 1,109,831 crossings in 2024 to 845,713 in 2025, a drop of nearly 24%. Comparing only 2026 with 2025 can therefore show improvement even while traffic remains substantially below the level seen before the downturn.
Blue Water’s Truck Decline Hits a Major Freight Route
The Blue Water Bridge is not simply another road between Canada and the United States. Its two spans connect Ontario’s Highway 402 with the I-69 and I-94 system in Michigan, giving manufacturers and carriers a direct route between Ontario and major industrial and distribution centres throughout the American Midwest. Federal transportation material has long identified automotive and agricultural products among the important commodities moving through the crossing.
That makes a fall from more than 1.4 million to approximately 1.2 million commercial truck crossings noteworthy. A truck count does not translate directly into the same percentage change in trade value because individual loads differ dramatically in value and weight. A tractor carrying auto components cannot be treated economically the same as an empty trailer or a shipment of lower-value bulk goods. Still, sustained changes in commercial vehicle volume can affect carriers, customs operations, toll receipts, warehouses and businesses built around cross-border freight movement.
Sault Ste. Marie Is Feeling a More Personal Border Slowdown
The Sault Ste. Marie International Bridge connects two communities that share far more than a commercial freight corridor. Residents regularly cross for shopping, restaurants, entertainment, family visits and other short trips, which means a reduction in passenger traffic can quickly become visible on local streets and in business receipts. The crossing’s 2025 total of 845,713 vehicles was about 264,000 lower than the 1.11 million recorded in 2024.
The International Bridge Administration estimated that reduced travel in 2025 was associated with at least US$82.9 million in lost local spending across the two Sault communities, according to reporting based on the authority’s calculations. Approximately US$62.7 million of that estimate was attributed to the Michigan side and US$20.2 million to Ontario. Such estimates depend on assumptions about average traveller spending, so they are not the same as audited business losses. They nevertheless illustrate why fewer routine border trips can matter disproportionately to smaller communities built around frequent cross-border movement.
Sault Traffic Has Started Recovering From Its 2025 Low
One of the most important qualifications to the broader decline is that Sault traffic is no longer falling on every comparison. The International Bridge Administration reported 99,731 one-way crossings in August 2026, an increase of 3.3% from August 2025. Through August 31, reported year-to-date traffic stood at 573,998 crossings, about 1.4% higher than during the same portion of 2025.
That does not erase the steep fall that occurred between 2024 and 2025. Instead, it suggests traffic may be stabilizing at a lower level and beginning a gradual recovery. The difference between those comparisons explains how passenger traffic can remain roughly 23% below 2024 while total 2026 crossings simultaneously run slightly ahead of 2025. For local merchants, the distinction is significant. A modest rebound can bring additional customers back across the bridge without restoring the volumes businesses had become accustomed to before the much larger 2025 decline.
Commercial Traffic Is Weak at the Sault Crossing Too
Passenger travel is not the only category under pressure in Sault Ste. Marie. Commercial truck crossings fell from 42,365 during the first eight months of 2025 to 36,716 over the same period in 2026. That represents a decline of roughly 13%, placing the commercial trend remarkably close to the 14% truck decline reported at Blue Water.
Monthly data have shown similar weakness. The International Bridge Administration’s July figures showed total crossings rising 4.4% from July 2025, yet commercial truck traffic was down 15.9%. The contrast is revealing: passenger and total traffic can begin improving while freight continues moving in the opposite direction. For transportation companies, a border crossing is chosen according to origin, destination, customer contracts, tolls, congestion and highway connections, so falling truck counts do not necessarily mean an equivalent amount of freight has disappeared entirely. Some loads may be cancelled, while others can move through different gateways or supply chains.
Canada-Wide Travel Data Show a Rebound With a Large 2024 Gap
Statistics Canada’s national figures provide an important check against assuming that every Canada-U.S. travel measure is continuing to deteriorate. In August 2026, Canadian-resident return trips from the United States by air and automobile reached approximately 2.6 million, an 8.8% increase from August 2025. Automobile return trips alone were up 9.9% from the previous year, marking part of a broader recovery in cross-border travel.
The longer comparison remains much weaker. Canadian automobile return trips from the United States in August 2026 were still 27.4% below their August 2024 level. At the same time, U.S.-resident trips to Canada increased 2.4% year over year in August 2026, including a 1% rise in automobile travel. In other words, the national picture increasingly resembles a partial rebound from a depressed 2025 rather than a simple continuation of the earlier collapse. Individual bridges can nevertheless move differently because their travellers, industries and competing routes are not the same.
Trade Tensions Are Part of the Explanation, but Not the Only Variable
Researchers and local officials interviewed about the Michigan crossings have linked some of the traffic weakness to the deterioration in Canada-U.S. trade relations and changing Canadian attitudes toward discretionary U.S. travel. Reporting from Sault Ste. Marie has documented residents choosing to shop or spend closer to home, while Michigan State University supply-chain professor Steven Melnyk has pointed to tariffs and bilateral tensions as factors affecting both passenger and commercial movements.
Those explanations should be treated as contributing factors rather than proof that every missing crossing was caused by politics. Exchange rates, fuel costs, economic conditions, freight demand, vacations, weather, tolls and the location of customers can all change border volumes. The national rebound in Canadian trips during 2026 also demonstrates that travel behaviour can shift quickly. The most defensible conclusion is that the political and trade environment coincided with a major drop from 2024 levels, while the recovery since 2025 has been uneven across different bridges and vehicle categories.
The Gordie Howe Bridge Is Changing Michigan’s Traffic Map
Another complication arrived on July 27, 2026, when the Gordie Howe International Bridge opened between Windsor and Detroit. In its first full month, approximately 343,500 total vehicle trips were recorded across the new bridge, putting its traffic close to that of the established Ambassador Bridge. Statistics Canada separately recorded 34,800 commercial trucks entering Canada through the Gordie Howe crossing during August.
The opening gives carriers and motorists another option in Canada’s busiest land-trade corridor. Canadian government figures say the Windsor-Detroit gateway carries roughly 30% of Canada-U.S. trade moved by truck and more than $274 million in trade each day. It is too early to assign a specific portion of the Blue Water decline to the new bridge, particularly because most of the January-August comparison occurred before Gordie Howe opened. Still, future bridge-by-bridge statistics will increasingly reflect routing choices as well as changes in the total amount of cross-border activity.
Lower Volumes Arrive While Bridges Still Require Major Investment
Traffic can change quickly, but bridges cannot stop needing maintenance when volumes decline. Michigan is proceeding with a major expansion of the Blue Water Bridge plaza. The second component, valued at approximately US$300 million, includes changes to tolling facilities, inspection infrastructure, local access and facilities used by U.S. Customs and Border Protection. Construction is expected to extend into the next several years.
Sault Ste. Marie faced the same basic reality on a smaller scale during the summer, when maintenance work included deck resurfacing and painting on the U.S. arch. The International Bridge Administration says toll revenue supports the bridge’s operating and maintenance costs, making traffic volume financially important as well as economically symbolic. Blue Water also raised eastbound passenger tolls to US$5 in December 2025 after years without comparable increases. Fewer crossings do not automatically make infrastructure projects unnecessary; in many cases, they leave operators balancing long-term capital needs against a potentially smaller toll-paying traffic base.
The Next Few Months Will Show Whether the Recovery Is Real
The most useful indicators now will be several months of consistent data rather than a single percentage. At the Sault crossing, attention will centre on whether the year-over-year gains seen in July and August continue through the autumn while passenger volumes close more of the gap with 2024. Commercial traffic deserves separate scrutiny because trucks have remained noticeably weaker even while overall Sault crossings improved.
Blue Water will require a similar distinction between freight and passenger vehicles. Analysts will also need to watch whether traffic is being redistributed among Blue Water, the Ambassador Bridge, the Detroit-Windsor Tunnel and the newly opened Gordie Howe bridge. The current evidence supports two conclusions at once: Canada-U.S. border movement has begun recovering from some of the lows recorded in 2025, but important crossings and vehicle categories remain well below earlier levels. For border communities and freight-dependent businesses, that difference between recovery and full normalization is likely to matter far more than any single monthly headline.
