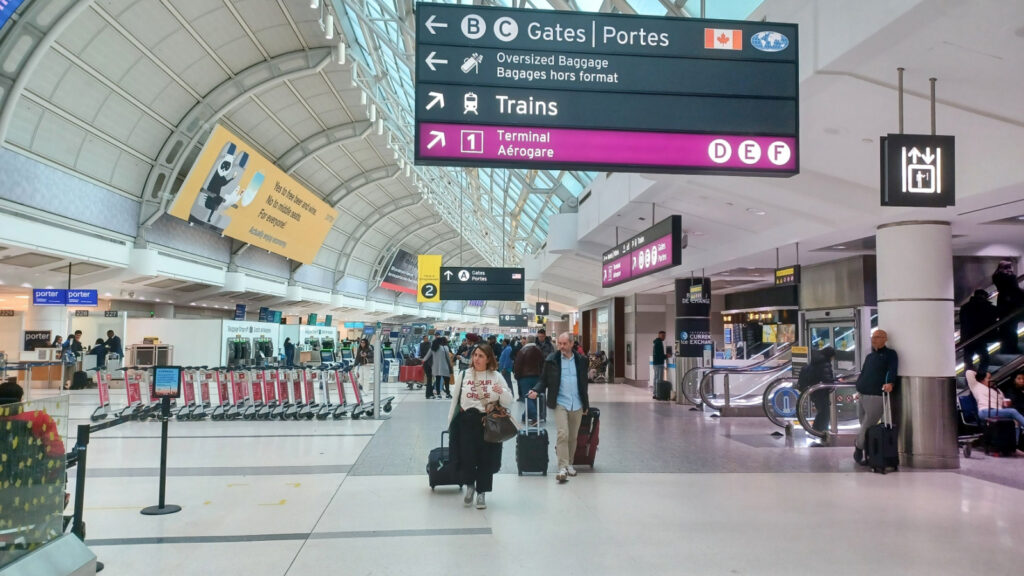
For the first time in a year and a half, one of the clearest measures of air travel from Canada to the United States has moved back into positive territory. Statistics Canada says 1.4 million passengers were screened for transborder flights at Canada’s eight largest airports in August 2026, up 5.9% from August 2025 and ending 18 consecutive months of year-over-year declines.
The turnaround is significant, but it does not mean Canada–U.S. air travel has fully recovered. August’s transborder passenger count remained 5.9% below the level recorded two years earlier, and the latest comparison was influenced by unusually weak traffic during an Air Canada labour disruption in August 2025. Still, alongside improving cross-border travel figures from July, the August numbers suggest the prolonged pullback in U.S.-bound Canadian air traffic may be entering a different phase.
The 18-Month Decline Finally Ends
August delivered a milestone that would have seemed unlikely during the sharpest part of the Canada–U.S. travel pullback. Statistics Canada recorded 1.4 million screened passengers travelling on transborder flights to the United States, a 5.9% increase from August 2025. More importantly, the gain ended 18 consecutive months in which U.S.-bound screening volumes had been lower than they were a year earlier. That stretch covered a period in which cross-border travel became one of the most visible examples of changing Canadian travel patterns.
A single positive month cannot establish a lasting trend, but the direction matters. Earlier in the decline, year-over-year losses were often sizeable. Transport Canada’s review of 2025 shows U.S. air passenger traffic from Canadian airports fell 6.4% for the year, equivalent to roughly 930,000 fewer passengers. Against that backdrop, a 5.9% increase in August 2026 represents more than routine seasonal movement. It marks the first break in a remarkably persistent sequence of declines.
What StatCan Is Actually Counting
The 1.4 million figure requires an important explanation. Statistics Canada’s monthly airport screening series is based on data from the Canadian Air Transport Security Authority’s Boarding Pass Security System. It measures people passing through pre-board security checkpoints at eight major Canadian airports: Halifax, Montreal, Ottawa, Toronto, Winnipeg, Calgary, Edmonton and Vancouver. In this case, the transborder category refers specifically to passengers screened for flights to the United States.
That makes the series an excellent near-term indicator of outbound airport activity, but it is not the same thing as counting every Canadian who visits the United States. Aircrew and airport employees are excluded, and connecting passengers who do not need to pass through security again may not appear as an additional screening. Statistics Canada also publishes separate border-entry statistics that measure residents returning to Canada and foreign residents entering the country. Keeping those datasets separate is important because each answers a different question, even when they point toward similar travel trends.
The Rebound Still Leaves a Noticeable 2024 Gap
August’s year-over-year increase looks encouraging until the comparison is stretched back another year. Statistics Canada reported that transborder screening volumes in August 2026 remained 5.9% below August 2024. In other words, the latest gain recovered some of the traffic lost during the long downturn, but it did not bring Canada–U.S. airport activity back to where it stood before the major shift in travel patterns that began in early 2025.
That two-year comparison gives the rebound more perspective. A market can post strong growth after a weak year without returning to its previous size, and the transborder figures illustrate exactly that effect. The latest numbers therefore support two conclusions at once: U.S.-bound airport traffic is finally growing again on a year-over-year basis, but the earlier decline was substantial enough that a meaningful gap remains. For airlines, airports and tourism businesses tied to cross-border passengers, whether that 2024 gap continues to narrow may matter more than a single positive monthly comparison.
Toronto and Montreal Lead While Vancouver Moves the Other Way
The national increase was not evenly distributed. Toronto Pearson, Canada’s largest airport, recorded a 13.2% year-over-year increase in screened transborder passengers in August. Montreal-Trudeau also produced a double-digit gain, with U.S.-bound screening traffic rising 11.7%. Those increases stand out because both airports serve large numbers of business travellers, tourists and connecting passengers moving between Canadian cities and major American markets.
Vancouver International told a different story. Its transborder passenger count fell 3.4% from August 2025, even as its overall screened passenger traffic increased during the month. The contrast illustrates why a national recovery should not automatically be treated as an identical recovery at every gateway. Geography, route networks and passenger demand can produce very different results. Toronto and Montreal were strong enough to help lift the national U.S.-bound total into positive territory, while Vancouver remained below its year-earlier transborder level. Future monthly data will show whether that regional split persists or begins to narrow.
The Air Canada Strike Makes the Year-Over-Year Gain Look Stronger
There is another reason to treat the 5.9% increase carefully. Statistics Canada specifically cautioned that August 2025 was affected by an Air Canada flight-attendant strike that lasted almost four days and resulted in thousands of flight cancellations. Those cancellations reduced the number of passengers moving through Canadian airport security checkpoints, creating an unusually weak comparison point for August 2026.
The effect is visible in the broader numbers. Across the eight airports covered by the dataset, 6.1 million passengers were screened in August 2026, up 6.1% from a year earlier. Some of that increase reflects healthy passenger demand, but some also reflects the fact that normal operations were being compared with a disrupted month. This does not erase the significance of the transborder turnaround: the 18-month declining streak still ended. It does mean the size of August’s improvement should not be interpreted in isolation. Comparisons with 2024 and subsequent months will provide a cleaner test of how much underlying demand has genuinely returned.
Domestic Flights Are Still Doing More of the Heavy Lifting
Cross-border traffic may finally be growing again, but domestic flying remains the stronger part of Canada’s airport recovery. Statistics Canada counted 3.0 million passengers screened for domestic flights in August, up 6.8% from the same month in 2025. It was the seventh consecutive month in which domestic traffic produced the strongest year-over-year growth among the major travel sectors covered by the airport screening data.
The strength was also geographically broad. Seven of the eight airports included in the Statistics Canada series recorded increases in domestic screening traffic, with Edmonton the only one to post a decline. That pattern continues a change that became clear during 2025. Transport Canada reported that domestic air passenger volumes increased 4.6% that year, adding nearly 1.5 million passengers, even as U.S. traffic declined. Canadians did not simply stop flying when U.S.-bound demand weakened. A significant share of passenger growth shifted toward travel within Canada, helping airports and carriers offset at least part of the transborder slowdown.
Non-U.S. International Travel Remains an Important Part of the Story
Flights beyond the United States also continued to grow. Statistics Canada says 1.7 million passengers were screened for non-U.S. international flights in August, an increase of more than 78,000 passengers, or 5.0%, from August 2025. Toronto Pearson accounted for a large share of that additional activity, screening more than 47,000 extra non-U.S. international passengers compared with the same month a year earlier, an increase of 6.4%.
The numbers fit a longer-running change in Canadian air travel. Transport Canada found overseas passenger traffic increased 5.6% in 2025, adding roughly 1.1 million passengers, while U.S. traffic moved in the opposite direction. Growth was particularly notable on routes connected with markets in Asia and Europe. That makes the latest transborder rebound more interesting: U.S.-bound travel is beginning to rise at a time when domestic and other international markets are already operating from a position of relative strength. The question is whether U.S. travel can regain share without reversing those other shifts.
Canada’s Airports Still Had a Busy Summer
The turnaround in transborder traffic occurred during an active summer for Canadian aviation overall. Statistics Canada says 17.2 million passengers passed through security at the eight largest airports during June, July and August 2026. That was 2.8% more than during the same three summer months in 2025. June through August are historically the busiest months for passenger screening, making the increase particularly meaningful for airport operations.
The summer also included the 2026 FIFA World Cup, with Toronto and Vancouver hosting a combined 13 matches during June and July. Interestingly, both airports recorded their strongest overall traffic growth of the summer in August, after their Canadian World Cup schedules were complete. Pearson’s total screened passenger count increased 10.2% year over year in August, while Vancouver’s rose 6.7%. Those overall gains should not be confused with transborder performance—Vancouver’s U.S.-bound traffic was still down—but they show that the airport system entered late summer with substantial passenger volumes across multiple travel segments.
Separate Border Data Suggest the Turn Began Before August
Another Statistics Canada dataset provides evidence that cross-border travel had already started improving before the August airport screening report. In July 2026, Canadian residents returned from 2.8 million trips to the United States, up 10.1% from July 2025. It was the fourth consecutive year-over-year increase in total Canadian-resident U.S. trips after 15 consecutive months of declines. Automobile travel accounted for much of the rebound, but air travel finally moved higher as well.
Canadian-resident return trips from the United States by air rose 0.6% in July to 567,000. Statistics Canada said that was the first year-over-year increase since August 2023, ending a 34-month streak of declines in that particular series. Travel in the opposite direction was also growing: U.S. residents made 3.5 million trips to Canada in July, up 9.1% from a year earlier, while U.S.-resident air arrivals increased 5.3% to 832,100. These figures use different methodology from airport screening statistics, but both datasets now show improvement.
The Bigger Shift in Canadian Travel Has Not Disappeared
The latest increase needs to be viewed against the scale of what happened during 2025. Statistics Canada estimates Canadians made approximately 23.1 million visits to the United States that year, down from about 30.2 million in 2024—a decline of roughly 7.1 million visits. At the same time, Canadian visits within Canada increased by about 5.0 million and overseas visits rose by roughly 1.3 million. Leisure travel to the United States was particularly affected, falling 21.5% from 2024.
Transport Canada’s aviation data tell a similar story from the airport side. U.S. passenger traffic declined 6.4% in 2025 while domestic travel increased 4.6% and overseas travel rose 5.6%. August 2026 therefore represents a meaningful change in direction, but not evidence that the earlier shift has been erased. With transborder screening still 5.9% below August 2024, the clearest interpretation is that Canada–U.S. air travel has begun recovering from a deep pullback. Whether that becomes a sustained return will depend on what the next several months of data show.
